| MATLAB Report Generator |
  |
Cell Table
Component
Cell Table
Category
Formatting
Description
The Cell Table component converts a rectangular cell array into a table and inserts the table into the report.
Attributes
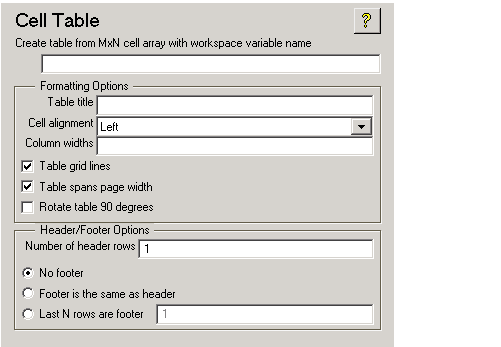
This is the Cell Table attribute page.

| Note
To view the component attribute page in the Setup File Editor, select the component in the setup file outline on the left and click on the Options tab. If the component is not in the setup file outline, you must add it to the outline first. See Building and Editing the Setup File for a discussion on how to add a component to the outline. |
- Create table from MxN cell array with workspace variable name
- Enter the name of the cell array that will be used to create the cell table.
Formatting Options
- Table title
- Enter the title of your table. If you have a title for a table, it is included in the List of Tables if the stylesheet you chose in the Report Options attribute page supports it. See Report Format and Stylesheets to find stylesheets that have a List of Tables.
- Cell alignment
- Select a cell alignment option (left, center, right or double justified).
- Column widths
- Input a vector with m elements where m equals the number of columns in the table. Column sizing is relative and normalized to page width. For example, if you have a 2x3 cell array and input the following into the Column widths field:
[1 2 3]- Then the report output format for the cell array would be as follows where column 2 is twice the width of column 1 and column 3 is three times the width of column 1:
- Note that if m is greater than the number of columns in the table, then the vector will be truncated so that the number of elements equals the number of columns. If m is less than the number of columns in the table, then the vector will be padded with 1's so that the number of elements equals the number of columns.
- Table grid lines
- Select this option if you want to have grid lines in your table. Grid lines create borders between the fields.
- Table spans page width
- Select this option if you want the table to have the same width as the page on which it appears.
- Rotate table 90 degrees
- Select this option to rotate the table 90 degrees.
Header/Footer Options
Designating a row as a header or footer row causes the contents of the row to be displayed in boldface.
- Number of header rows
- Enter the number of header rows (from the top): 0=none, 1= 1 row from top, 2 = two rows from the top, etc.
- No footer
- If you do not want a footer, select No footer.
- Footer is the same as header
- Select this option to create a footer that is identical to the header.
- Last N rows of cell array are footer
- If you want to select a footer that is different from your header, then select Last N rows of cell array are footer and enter the number of footer rows (from the bottom) in the corresponding field: 0 = none, 1 = one row from bottom, 2 = two rows from the bottom, etc.
Example
For example, if you have the following cell array in the MATLAB workspace
then the resulting cell table has the following appearance.
Note that in this example, the table has no headers or footers and no title. The table does have grid lines.
Insert anything into report?
Yes. Table.
Filename
cfrcelltable
 | Formatting Components | | Chapter/Subsection |  |


