| SimPowerSystems | |
Implement an N-phase distributed parameter transmission line model with lumped losses
Library
Description
The Distributed Parameter Line block implements an N-phase distributed parameter line model with lumped losses. The model is based on the Bergeron's traveling wave method used by the Electromagnetic Transient Program (EMTP)[1]. In this model, the lossless distributed LC line is characterized by two values (for a single-phase line): the surge impedance  and the phase velocity
  .
.
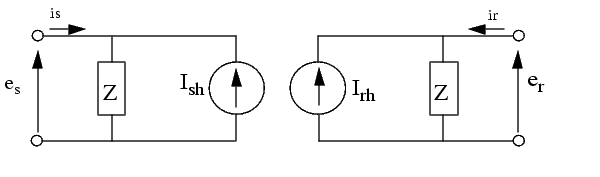
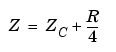
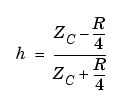
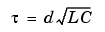
The model uses the fact that the quantity e+Zi, where e is line voltage and i is line current, entering one end of the line must arrive unchanged at the other end after a transport delay of  , where d is the line length. By lumping R/4 at both ends of the line and R/2 in the middle and using the current injection method of Power System Blockset, the following two-port model is derived.
For multiphase line models, modal transformation is used to convert line quantities from phase values (line currents and voltages) into modal values independent of each other. The previous calculations are made in the modal domain before being converted back to phase values.
In comparison to the PI sections line model, the distributed line represents wave propagation phenomena and line end reflections with much better accuracy. See the comparison between the two models in the Example section.
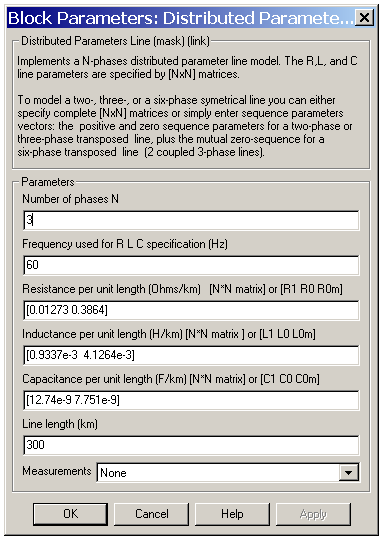
Dialog Box and Parameters
 /
/ µ).
µ).| Measurement |
Label |
Limitations
This model does not represent accurately the frequency dependence of RLC parameters of real power lines. Indeed, because of the skin effects in the conductors and ground, the R and L matrices exhibit strong frequency dependence, causing an attenuation of the high frequencies.
Example
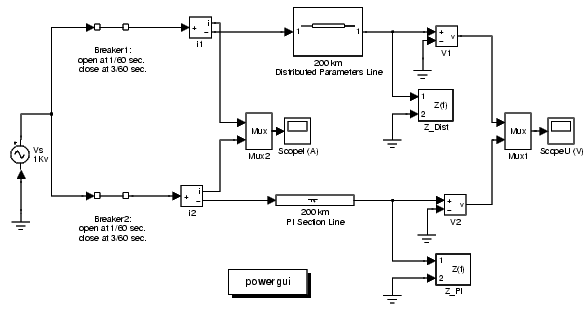
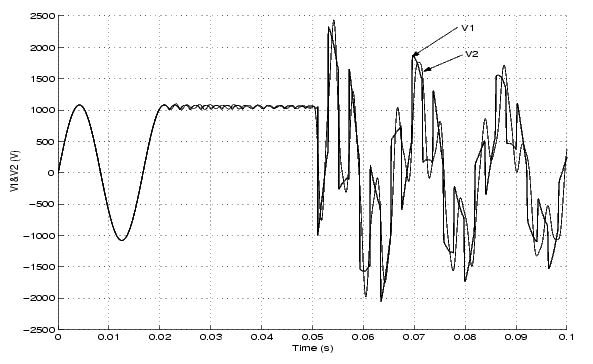
The psbmonophaseline.mdl demo illustrates a 200 km line connected on a 1 kV, 60 Hz infinite source. The line is deenergized and then reenergized after 2 cycles. The simulation is performed simultaneously with the Distributed Parameter Line block and with the PI Section Line block.
The receiving end voltage obtained with the Distributed Parameter Line block is compared with the one obtained with the PI Section Line block (two sections).
Open the powergui. Click the Impedance vs Frequency Measurement button. A new window appears, listing the two Impedance Measurement blocks connected to your circuit. Set the parameters of Impedance vs Frequency Measurement to compute impedance in the 0:2000 Hz frequency range, select the two measurements in the list, then click the Update button. 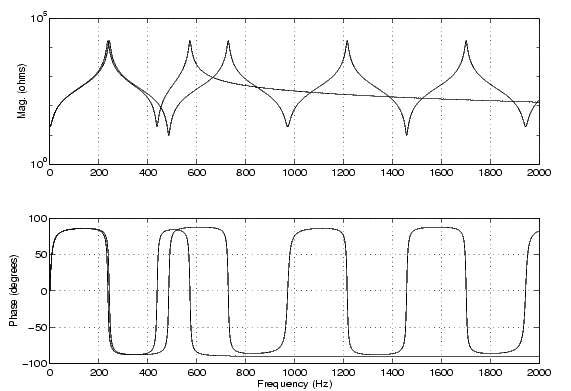
The distributed parameter line shows a succession of poles and 0s equally spaced, every 486 Hz. The first pole occurs at 243 Hz, corresponding to frequency f = 1/(4 * T) where
The PI section line only shows two poles because it consists of two PI sections. Impedance comparison shows that a two-section PI line gives a good approximation of the distributed line for the 0 to 350 Hz frequency range.
References
[1] Dommel, H, "Digital Computer Solution of Electromagnetic Transients in Single and Multiple Networks," IEEE Transactions on Power Apparatus and Systems, Vol. PAS-88, No. 4, April, 1969.
See Also
| | Discrete System | dq0_to_abc Transformation | |