| Model Predictive Control Toolbox | |
Determine the impulse response coefficients for a multi-input single-output system via Partial Least Squares (PLS).
Syntax
[theta,w,cw,ssqdif,yres] =plsr(xreg,yreg,ninput,lv) [theta,w,cw,ssqdif,yres] =plsr(xreg,yreg,ninput,lv,plotopt)
Description
Given a set of regression data, xreg and yreg, the impulse response coefficient matrix, theta, is determined via PLS. Column i of theta corresponds to the impulse response coefficients for input i. Only a single output is allowed. The number of inputs, ninput, and the number of latent variables, lv, must be specified.
Optional output w is a matrix of dimension n (number of impulse response coefficients) by lv consisting of orthogonal column vectors maximizing the cross variance between input and output. Column vector cw (optional) contains the coefficients associated with each orthogonal vector for calculating theta (theta=w*cw).
Optional output ssqdif is an lv-by-2 matrix containing the percent variances captured by PLS. The first column contains information for the input; the second column for the output. Row i of ssqdif gives a measure of the variance captured by using the first i latent variables.
The output residual or prediction error (yres) is also returned (optional).
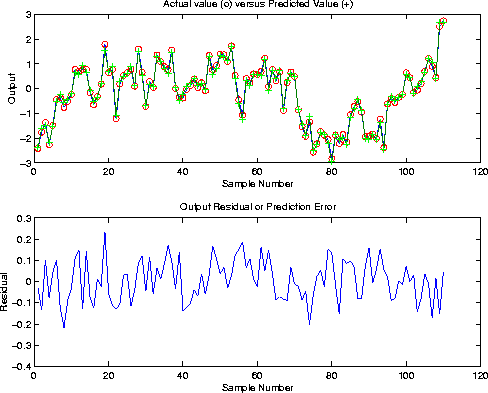
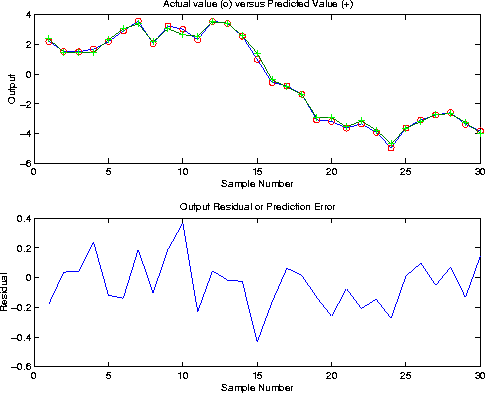
No plot is produced if plotopt is equal to 0, which is the default; a plot of the actual output and the predicted output is produced if plotopt=1; two plots -- plot of actual and predicted output, and plot of output residual -- are produced for plotopt=2.
Example
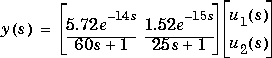
Consider the following two-input single-output system:
Load the input and output data. The input and output data were generated from the above transfer function and random zero-mean noise was added to the output. Sampling time of 7 minutes was used.
Put the input and output data in a form such that they can be used to determine the impulse response coefficients. 30 impulse response coefficients (n) are used.
Determine the impulse response coefficients via plsr using 10 latent variables. By specifying plotopt=2, two plots -- plot of predicted output and actual output, and plot of the output residual (or predicted error) -- are produced.
Use a new set of data to validate the impulse model.
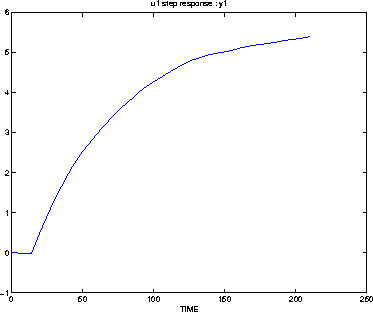
Convert the impulse model to a step model to be used in MPC design. Sampling time of 7 minutes was used in determining the impulse model. Number of outputs (1 in this case) must be specified.
Plot the step response coefficients.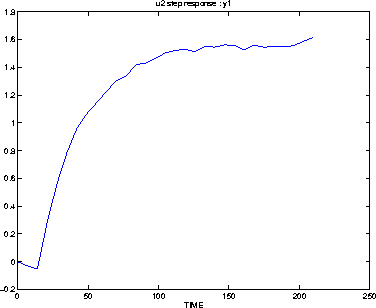
See Also
mlr, validmod, wrtreg
| plotstep | poly2tfd, poly format | |