| Model Browser User's Guide |
  |
Maximum Likelihood Estimation
The global models were created in isolation without accounting for any correlations between the response features. Using MLE (maximum likelihood estimation) to fit the two-stage model takes account of possible correlations between response features. In cases where such correlations occur, using MLE significantly improves the two-stage model.
- You reach the MLE dialog from the local node (PS22 in this case) by
- Clicking the
 button in the toolbar
- Or by choosing Model -> Calculate MLE
- Leave the algorithm default settings and click Start to calculate MLE.
- Watch the progress indicators until the process finishes and a two-stage RMSE (root mean square error) value appears.
- Click OK to leave the MLE dialog.
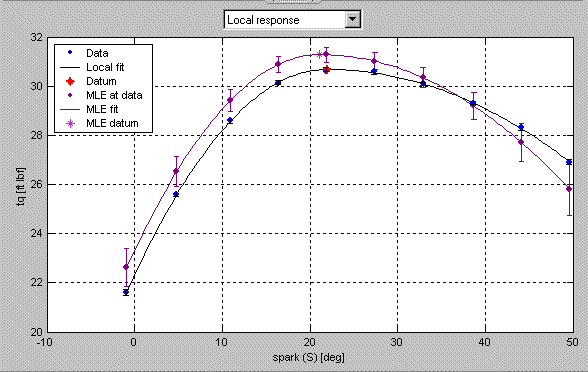
- Now the plots on the Local Model pane all show the two-stage model in purple to indicate that it is an MLE model. This is also indicated in the legend. Notice that all the model icons in the tree (the response, the local model, and the response features) have also changed to purple to indicate that they are MLE models.

- Click the Select button. This takes you to the Model Selection window.
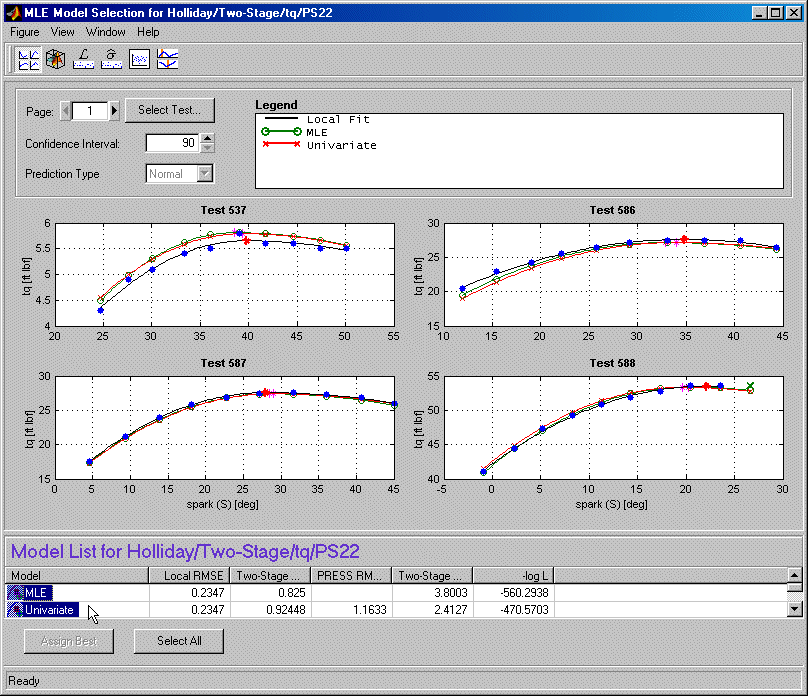
- Here you can compare MLE with the univariate model previously constructed (without correlations). By default the local fit is plotted against the MLE model.
- Select both MLE and the Univariate model for plotting by holding down Shift while you click the Univariate model in the Model List at the bottom of the view.

- Close the Model Selection window. Click Yes to accept the MLE model as the best.
 | Comparing the Local Model and the Two-Stage Model | | Response Node |  |


