| CAGE User's Guide |
  |
Inverting Two-Dimensional Tables
To invert a two-dimensional table:
- Ensure that your session contains two tables:
- The first table from your forward strategy, filled
- The second table from your backward strategy, which you want to fill
- Highlight the second table.
- Click
 or select Table -> Inversion.
- The lower pane now acts as a wizard.
- In the lower pane, highlight the table that you want to invert.
- Click Next.
- Identify the corresponding signals.
- The forward table and backward table share a common input. This page of the wizard lists all possible combinations of inputs into the forward and backward tables and asks you to highlight the combination that gives the two common inputs. To illustrate this, if the forward table gives torque in terms of the variables engine speed and load, whereas you want the backward table to give load in terms of RPM and Tq, then the list would read
- RPM and engine speed
- RPM and load
- Tq and engine speed
- Tq and load
- In this case, you would select the first option.
- Highlight the part of the table to invert, then click Next.
- CAGE asks what to do if it encounters multiple values. The choices are
- Maximum selects the uppermost range (like choosing a positive square root of a number).
- Minimum selects the lower value if there are two choices (like choosing a negative square root of a number).
- Intermediate selects the middle range when there are more than two choices.
- Automatic selects the range that produces the least error. CAGE tries to choose values to put in the inverse table that minimize an error metric similar to the error metric for 1-D tables (see Inverting One-Dimensional Tables).
- Choose one of these options and click Next.
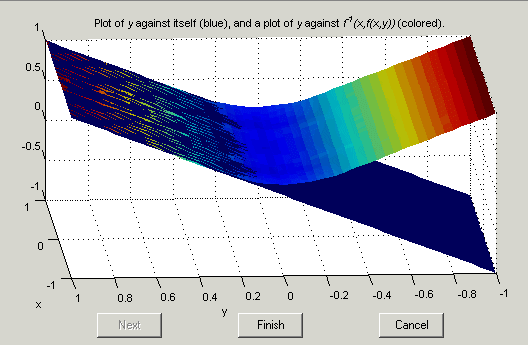
- The last page of the wizard has a comparison plot that shows how successful the inversion has been. If the forward function is z = f(x,y), and the inverse function is x = g(y,z), then, combining these, in an ideal world you should have x = g(y,f(x,y)). The plot then displays a plane showing x plotted against x and y, and a colored surface showing g(y,f(x,y)) plotted against x and y. The closeness of these two planes indicates how good the inversion is. Following is an example. In this case, the forward table is a quadratic (z = y^2); the backward table is inverted using the positive square root of z (maximum range). As you can see, this leads to large errors at negative values of y, but good inversion for positive values of y.

- Click Finish to accept the result or Cancel to ignore the result and return to the original table.
 | Inverting One-Dimensional Tables | | Table View |  |


 or select Table -> Inversion.

