| CAGE User's Guide |
  |
Filling Tables from Experimental Data
Any table in the project whose axes (normalizers) exist as factors in the data set can be filled from imported experimental data.
CAGE extrapolates the values of the experimental data over the range of your table. Then it fills the table by selecting the values of the extrapolation at your breakpoints.
To fill the table with values based on the experimental data:
- To view the Table Filler display, click
 in the toolbar.
- This display asks you to specify the table you want to fill and the factor you want to use to fill it.
- In the lower pane, select the table from the Table list. This is the table that you want to fill.
- Select the experimental data from the Factor list. This is the data that you want to use to fill the table.
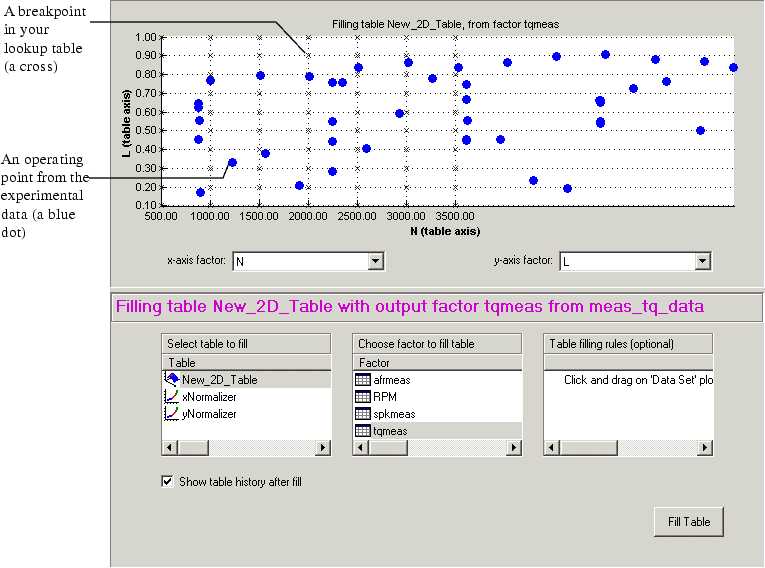
- For example, see the following display.

- The upper pane displays the breakpoints of your table as crosses, and the operating points where there is data as blue dots.
- To view the table after it is filled, make sure the Show table history after fill box at the bottom left is selected. This is selected by default.
- Data sets always display the points in the experimental data, not the values at the breakpoints.
- To fill the table, click Fill Table.
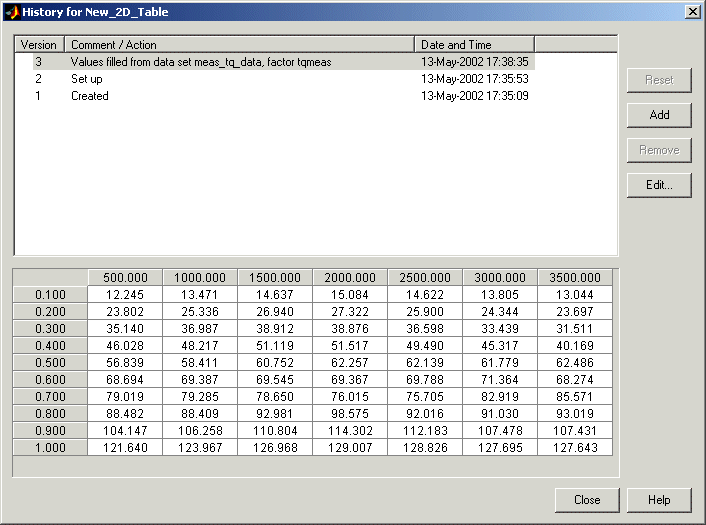
- If the Show table history after fill box is selected, the History dialog box opens, similar to the one shown.

- Click Close to close the History dialog box and return you to the Table Filler display.
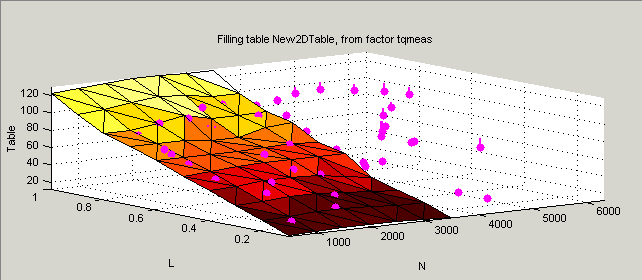
- To view the graph of your table, select Data -> Plot -> Surface.

This display shows the table filled with the experimental points overlaid as purple dots.
 | Manipulating Models in Data Set View | | Creating Rules |  |


