| Mapping Toolbox | |
Construct a thematic map with proportional symbols
Syntax
scatterm
scatterm(lat,lon)
scatterm(lat,lon,s)
scatterm(lat,lon,s,c)
scatterm(...,m)
scatterm(...,'filled')
Description
scatterm(lat,lon,s,c) displays colored circles at the locations specified by the vectors lat and lon (which must be the same size). The area of each marker is determined by the values in the vector s (in points2) and the colors of each marker are based on the values in c. s can be a scalar, in which case all the markers are drawn the same size, or a vector the same length as lat and lon.
When c is a vector the same length as lat and lon, the values in c are linearly mapped to the colors in the current colormap. When c is a length(lat)-by-3 matrix, the values in c specify the colors of the markers as RGB values. c can also be a color string.
scatterm(lat,lon) draws the markers in the default size and color.
scatterm(lat,lon,s) draws the markers with a single color.
scatterm(...,m) uses the marker m instead of 'o'.
scatterm(...,'filled') fills the markers.
scatterm, without any inputs, will activate a GUI to project point data onto the current map axes.
h = scatterm(...) returns handles of patches created.
Examples
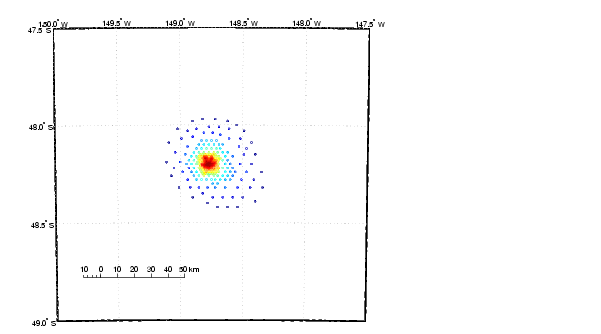
Plot the seamount data provided with MATLAB as symbols with the color proportional to the height.
See Also
stem3m |
Project stem plot on map axes |
| | scaleruler | scircle1 | |