| Mapping Toolbox | |
Example One: Creating a World Map
The Mapping Toolbox comes with world atlas data in the worldlo workspace. This data will be used in the following example to create a simple line map of the world. The first step is to create a map axes. From the MATLAB command prompt, type:
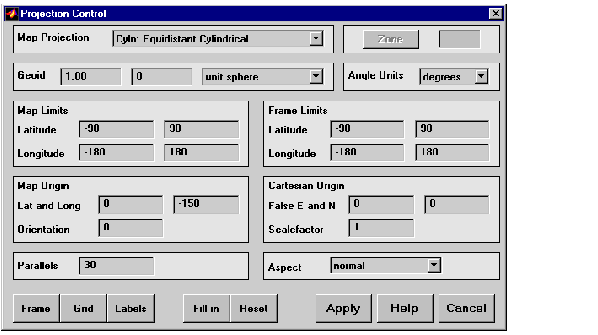
This creates a new figure window and brings up the Projection Control dialog box. Use the Map Projection pull-down menu to define an Equidistant Cylindrical projection and change the map origin longitude to center the map at 150 degrees West:
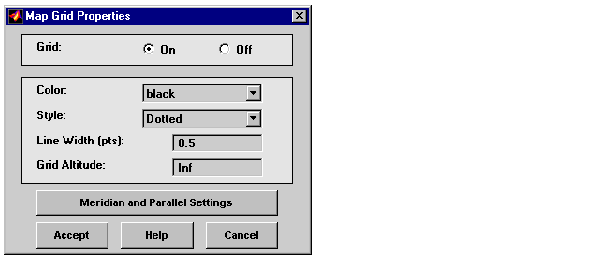
Press the Grid button to activate the Map Grid Properties dialog box and turn the grid on:
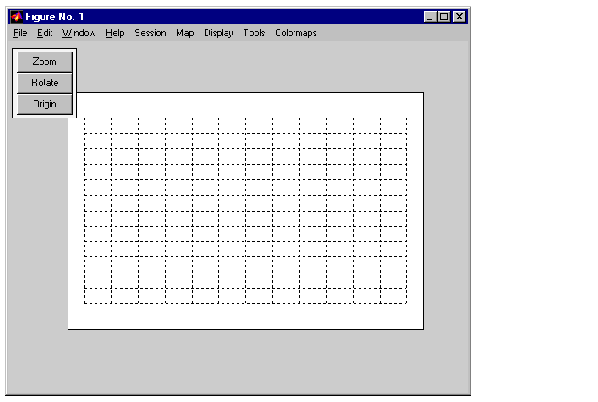
Press Accept to return to the Projection Control box, and press Apply to apply the settings to the map axes:
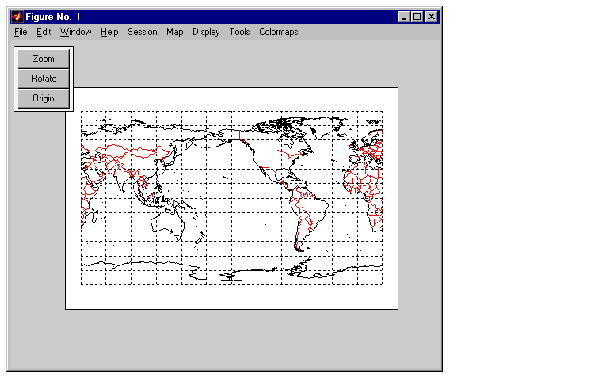
Select Session LayersWorld LoRes from the menu bar to activate the
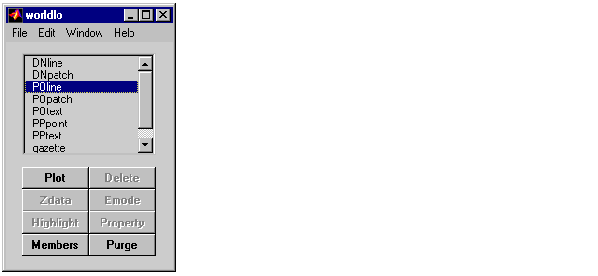
 mlayers GUI with the worldlo workspace. This brings up the worldlo dialog box, which lists all the structures in the worldlo workspace:
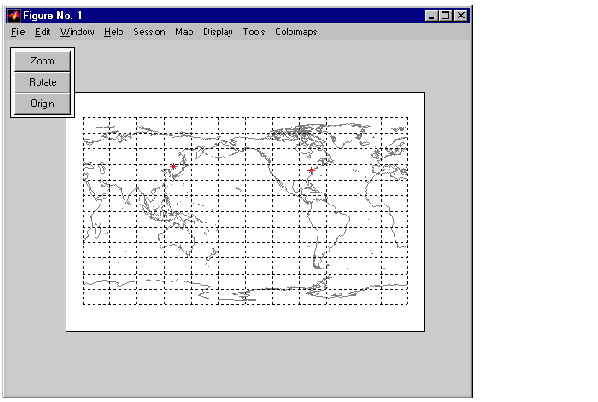
Select POline in the list box, and press the Plot button to display political/ocean boundaries. Your figure now displays coastlines and international boundaries:
Close the worldlo dialog box. The worldlo variables associated with the dialog box have been removed from the workspace, but the plotted objects remain on the map.
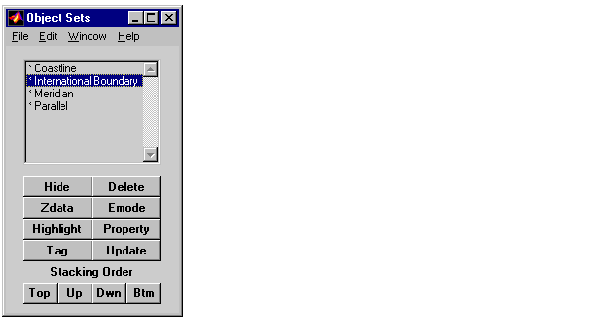
To view and edit properties of currently mapped objects, use the mobjects GUI. Select ToolsObjects from the menu bar. The Object Sets dialog box appears, which lists all the objects on the current map axes. An asterisk(*) next to an object indicates that it is visible, and an h next to an object indicates that it is currently hidden.
Select International Boundary and press the Delete button. A Confirm Deletion dialog box appears. Deleting an object set removes it from the current map axes. Press Yes to continue the deletion process.
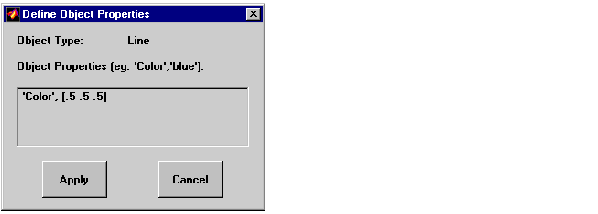
The figure now displays only coastlines. Change the coastlines from black to gray by selecting Coastline from the list box and pressing the Property button. The Define Object Properties box appears. Multiple pairs of property names and values can be entered in this dialog box, but you would simply like to change the color of your coastlines from black to gray.
Type 'Color',[.5 .5 .5] in the Object Properties edit box, and press Apply:
The coastlines change to gray. Close the Objects Sets dialog box.
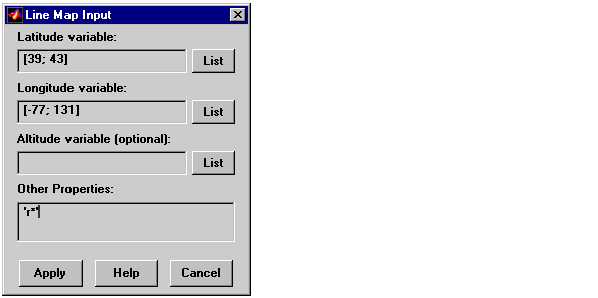
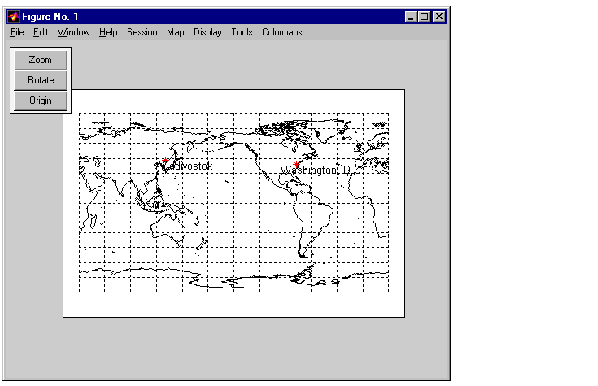
Next we will plot two cities, Washington, D.C. and Vladivostok, Russia. Choose MapLines from the menu bar. The Line Map Input box appears. Enter the latitude vector [39; 43] and the longitude vector [-77; 131]. Note that you may also enter workspace variables as the latitude and longitude values. In the Other Properties edit box, type 'r*' to plot a red marker at each city location. Press Apply.
The city markers now appear on the map:
Select SessionCommand from the menu bar. The Workspace Commands dialog box appears. This dialog box allows command line statements to be executed directly from maptool, rather than from the MATLAB command window. To plot city labels on the map, use the gtextm interactive tool, which will position strings at locations on the map specified by a mouse click. Enter the following in the Workspace Commands edit box:
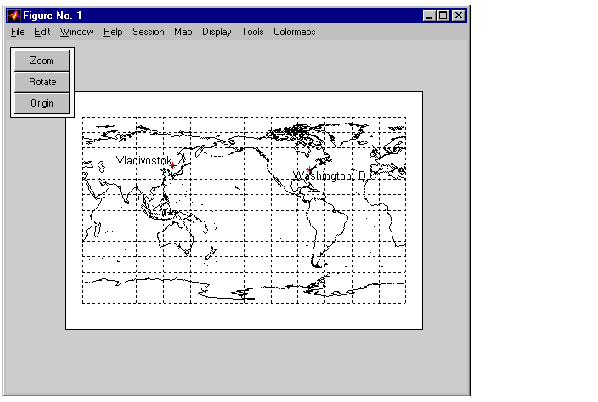
Press Apply. A crosshair appears on the map. The first input string is 'Washington, D.C.', so click in the vicinity of the Washington, D.C. city marker on the map. The string will be placed at that location. Next click near the Vladivostok city marker, and the second string will be placed there.
A Status Report box appears after each workspace command that is successfully completed. Here is the result of the gtextm operation:
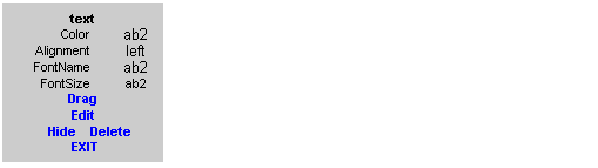
The properties of many mapped objects can be edited with the Click-and-Drag Property Editor tool. Right-clicking on an object activates this functionality and allows for property manipulation through simple mouse clicks and drags. To reposition the Vladivostok label to make it easier to read, right-click on the text string. A Click-and-Drag Property Editor box for text objects appears:
Click Drag, and the label will now follow the mouse pointer as it is moved across the map display. (The Click-and-Drag tool can be moved out of the way by holding down the Shift key and dragging the box aside.) Position the label where you like, and click to place the text:
For more information on using the Click-and-Drag Property Editor tool, see the "GUI Reference" chapter of the online Mapping Toolbox reference documentation.
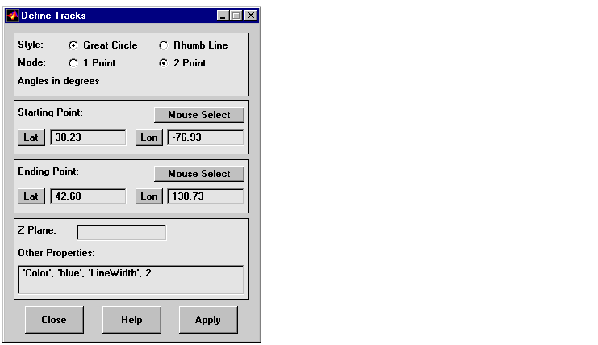
A great circle is the shortest distance between two places and can be used to determine approximate airplane flight routes. To plot a route between Washington, D.C. and Vladivostok, you can use the trackui tool. Select DisplayTracks from the menu bar. The Define Tracks dialog box appears.
Select Great Circle, 2 Point mode. To specify Washington, D.C. as the starting point for your first track, press the Mouse Select button.
A crosshair appears on the map display. Position it over the city marker and click. The coordinates appear in the Starting Point Lat and Lon boxes. Using the Ending Point Mouse Select button, select Vladivostok as your ending point.
In the Other Properties edit box, type
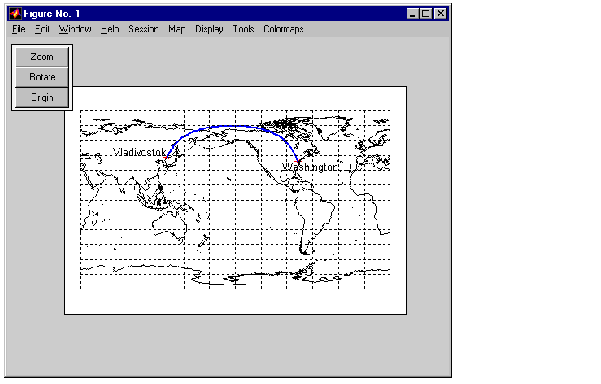
Press Apply, and the flight track is displayed:
If you would like to save your map, select FileSave from the menu bar to save the figure window in an M-file. The Zoom and Rotate buttons should be turned off before saving. When you execute the M-file, the figure and uicontrols will be recreated to their original appearance.
| | The Mouse Tool Buttons | Example Two: Creating a Regional Map | |