| Mapping Toolbox | |
Creating a Personalized Colormap
Now you can use the colorm tool to make a custom colormap for your map of Japan. To activate the colorm GUI, type:
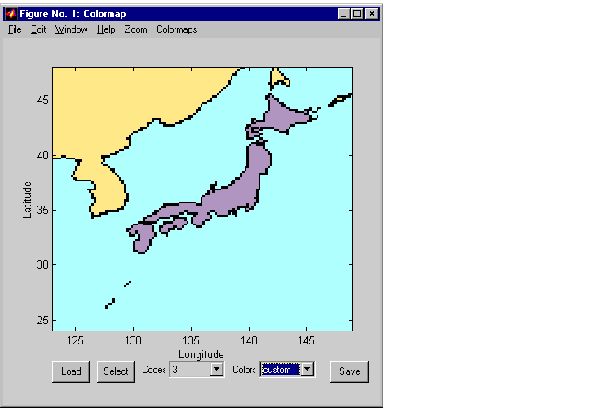
A new figure window displays the map. Recall that the values for this matrix map are as follows: coastlines = 1, Japan = 2, water = 3, and other countries = 4.
To change the coastlines to black, select 1 from the Codes menu, and choose black from the Color menu. Next, make Japan a light purple by selecting 2 from the Codes menu and choosing custom from the Color menu. The Custom Color GUI appears.
Select a custom color, and choose OK. Japan will change to the new color. Next, change the color of all other countries to a light beige by selecting 4 from the Codes menu, and custom from the Color menu. Use the Custom Color GUI to choose a light beige color, then press OK.
Finally, to change the color of water to a light blue, select 3 from the Codes menu and custom from the Color menu. Choose a light blue from the Custom Color GUI and press OK. The map of Japan now appears:
Press the Save button, then press OK to accept the default name clrmap for the new colormap variable. The Color Map dialog box can now be closed.
To display the map of Japan, type axesm.
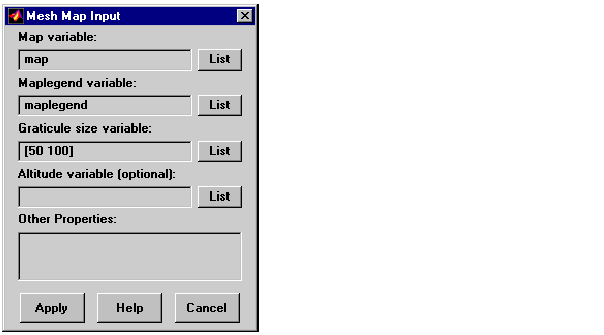
In the Projection Control box, choose a Miller Cylindrical projection and define the map latitude and longitude limits to be [24 48] and [123 149], respectively.
Use the Grid button to turn the grid on, then press the Parallel and Meridian Settings button and set the longitude locations and latitude locations to 5 to display grid lines every 5 degrees.
Use the Label button to turn the meridian and parallel labels on. Change the label format to none. Press Parallel and Meridian Settings button and change the longitude and latitude label locations to 5 to display labels every five degrees. Press Apply to apply the settings to the map axes.
To plot the map of Japan using the Mesh Map Input dialog box, type meshm.
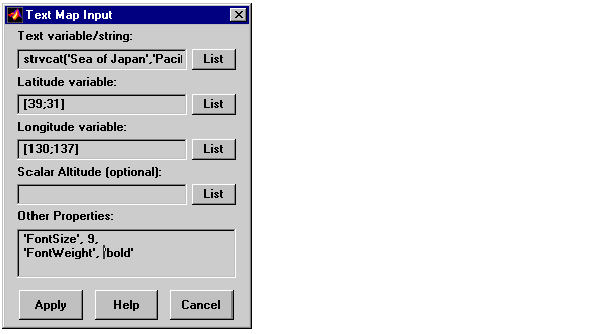
Your variable names are the same as the defaults, so press Apply to plot the map. After the map is plotted, type colormap(clrmap). This will set the current colormap to the customized one you created. To annotate the major bodies of water in the display, type textm.
The Text Map Input dialog box appears. In the Text variable/string edit box, enter the following:
In the Latitude variable edit box enter [39;31], and in the Longitude variable edit box enter [130;137]. In the Other Properties edit box, enter 'FontSize',9 and 'FontWeight','bold'.
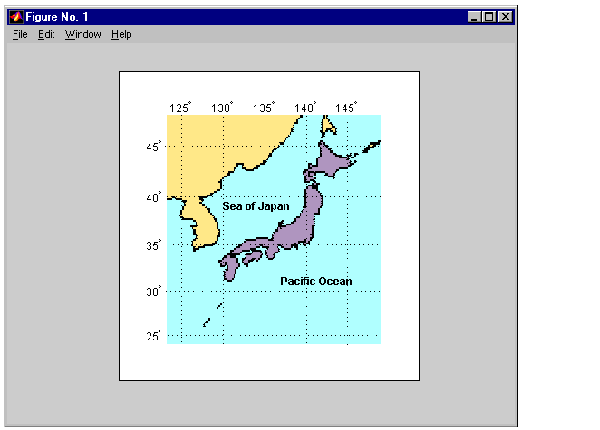
The final display of your customized map of Japan appears as follows:
The primary utility of such matrix maps is not display, but analysis. You can use this map to quickly identify whether a particular geographic location belongs to Japan, for example. See the political matrix maps section in Atlas Data for more examples.
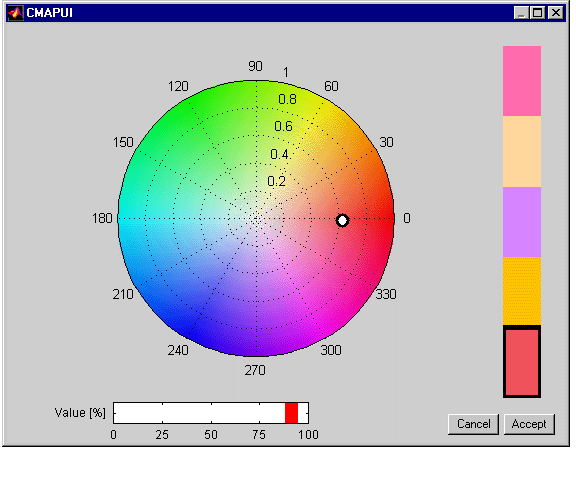
You can also create personalized colormaps that do not depend on a matrix map using cmapui. The cmapui panel allows you to select color entries in a colormap by clicking on the colorbar. To change the color's hue and saturation, drag the color Marker on the colorwheel. To control the value of the color in HSV space, drag the red Slider. Clicking the Accept button returns the modified colormap.
Here is an example of a colormap with five colors. The first color in the colormap is currently selected.
| | Encoding a Regular Surface Map | External Data Interface | |