| Mapping Toolbox | |
Create colormaps for digital elevation maps
Syntax
demcmap(map)
demcmap(map,ncolors)
demcmap(map,ncolors,cmapsea,cmapland)
demcmap(color,map,spec)
demcmap(color,map,spec,cmapsea,cmapland)
[cmap,caxis] = demcmap(...)
Description
demcmap(map) creates and assigns a colormap for elevation data. The colormap has the number of land and sea colors in the same proportions as the maximum elevations and depths in the matrix map. With no output arguments, the colormap is applied to the current figure and the coloraxis is set so that the interface between the land and sea is in the right place.
demcmap(map,ncolors) makes a colormap with a length of ncolors. The default value is 64.
demcmap(map,ncolors,cmapsea,cmapland) allows the default colors for sea and land to be replaced. The colors in the created colormap are interpolated from the RGB color matrix inputs, which can be of any length. Default colors for either land or sea can still be retained by providing an empty matrix in place of the color matrices. The current figure colormap can be specified by entering the string 'window' in place of either RGB matrix.
demcmap(color,map,spec) uses the color string to define a colormap. If the string is set to 'size', spec is the length of the colormap. If it is set to 'inc', spec is the size of the altitude range assigned to each color. If omitted, color is 'size' by default.
demcmap(color,map,spec,cmapsea,cmapland) allows for both coloring options along with specified colors.
Examples
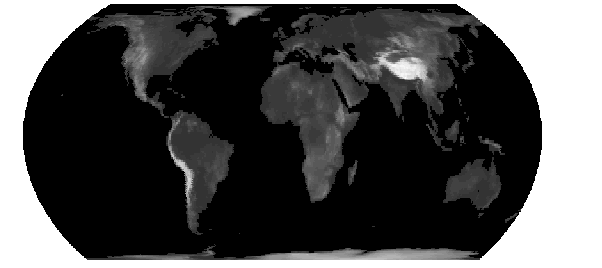
Display world topographical map using grayscale colors:
See Also
caxis |
Color axis scaling (see online MATLAB Function Reference) |
colormap |
Set and get the current colormap (see online MATLAB Function Reference) |
meshlsrm |
Project 3-D lighted shaded relief of regular matrix map |
meshm |
Display a regular matrix map warped to a projected graticule |
surflsrm |
Project 3-D lighted shaded relief of general matrix map |
surfm |
Display a matrix map warped to a projected graticule |
| | deg2rad | departure | |