| Mapping Toolbox | |
Syntax
h1 = clabelm(c,h)
h1 = clabelm(c,h,v)
h1 = clabelm(c,h,'manual')

h1 = clabelm(c)
h1 = clabelm(c,v)
h1 = clabelm(c,'manual')
Description
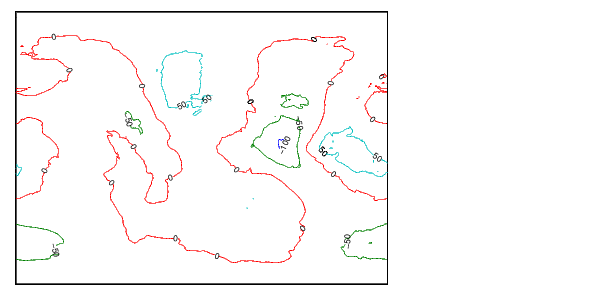
The clabelm function adds height labels to a two-dimensional contour plot. By default, clabelm labels all displayed contours and randomly selects label positions.
c is the contour matrix as described on the contourm reference page of this guide; h is the vector of handles for the displayed contours.
h1 = clabelm(c,h) rotates the labels and inserts them in line with the contour lines. The handles of the labels can be returned in h1.
h1 = clabelm(c,h,v) creates in line labels only for those levels specified in the vector v.
h1 = clabelm(c,h,'manual') places contour labels at locations you select with a mouse. You press the left mouse button (the only mouse button on a single-button mouse), or the Space bar to label a contour at the closest location beneath the center of the cursor. Press the Return key while the cursor is within the figure window to terminate labeling. The labels are inserted in line with the contour lines.
h1 = clabelm(c), h1 = clabelm(c,v), and h1 = clabelm(c,'manual') operate as the above, except that instead of rotating the labels and placing them in line with the contours, the labels are upright, and a `+' indicates which contour line the label is annotating.
Examples
See Also
clegendm |
Display a legend for a contour plot of map data |
contourm |
Project a contour plot of map data |
contour3m |
Project a 3-D contour plot of map data |
clabel |
Contour plot elevation labels (see online MATLAB Function Reference) |
| | changem | clegendm | |