| Fuzzy Logic Toolbox | |
System Display Functions
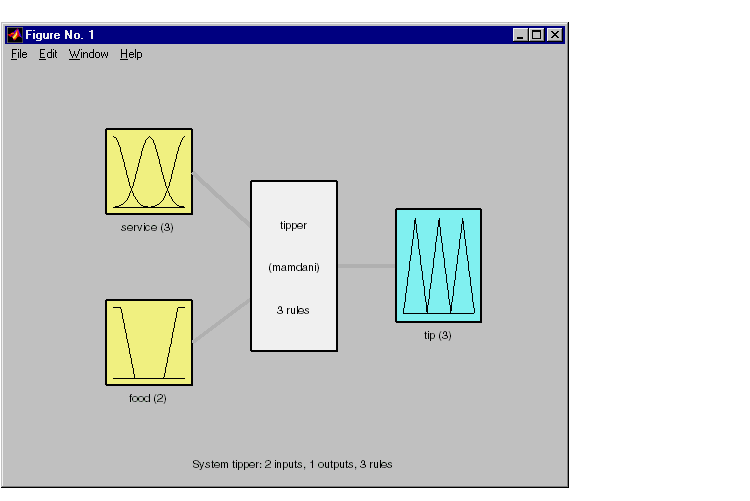
There are three functions designed to give you a high-level view of your fuzzy inference system from the command line: plotfis, plotmf, and gensurf. The first of these displays the whole system as a block diagram much as it would appear on the FIS Editor.
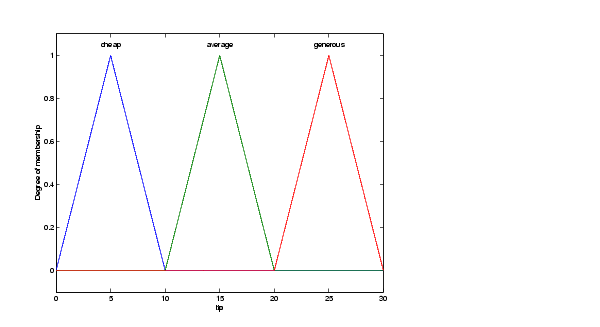
After closing any open MATLAB figures or GUI windows, the function plotmf plots all the membership functions associated with a given variable as follows.
These plots will appear in the Membership Function Editor GUI, or in an open MATLAB figure, if plotmf is called while either of these is open.
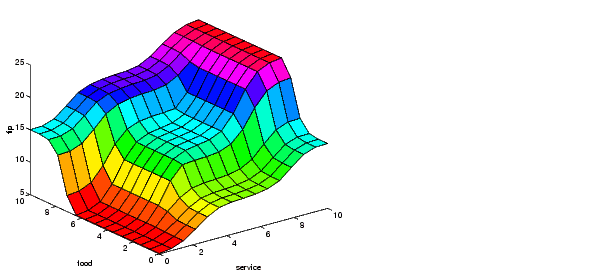
Finally, the function gensurf will plot any one or two inputs versus any one output of a given system. The result is either a two-dimensional curve, or a three-dimensional surface. Note that when there are three or more inputs, gensurf must be generated with all but two inputs fixed, as is described in the description of genfis in Function Reference.
| | Working from the Command Line | Building a System from Scratch | |