| Database Toolbox |
  |
Report Display of Results in a Table
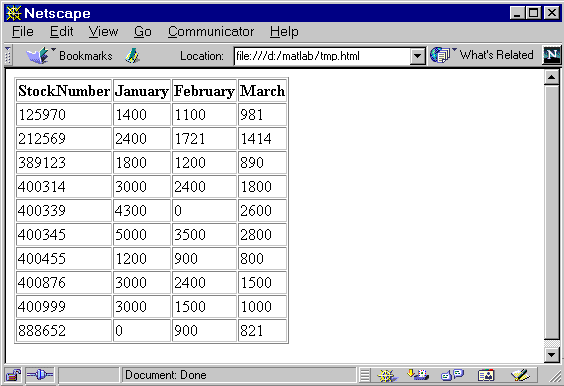
The report display presents the results in your system's default Web browser.
- Because some browser configurations do not launch automatically, start your Web browser before using this feature.
- After executing a query, select Report from the Display menu.
- The query results appear as a table. If you have the Report Generator product installed, the appearance of the report will be slightly different than what is shown here.

Each row represents a record from the database. For example, sales for item 400876 are 3000 in January, 2400 in February, and 1500 in March.
- Use your Web browser to save the report as an HTML page if you want to view it later. If you do not save it, the report will be overwritten the next time you select Report from the Display menu. To print the report, use the print features in your Web browser.
 | Chart Display of Results | | Customized Display of Results in the Report Generator |  |


