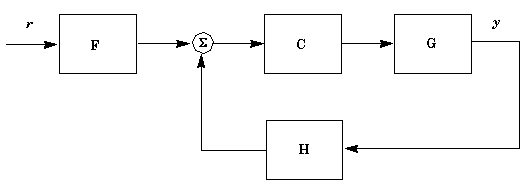
The prefilter Bode diagram displays magnitude and phase plots for your system.
Bode Magnitude Plot
The Bode magnitude diagram displays two curves:

Grab the green curve with your mouse and drag it up and down to adjust the prefilter gain. Use the right-click menu to add dynamics to the prefilter.
Bode Phase Plot
The Bode phase diagram also displays two curves. The green curve represents the prefilter Bode phase The magenta curve displays the closed-loop Bode phase response from command r to output y, as shown in the figure above.