| Communications Blockset | |
Generating Error Curves
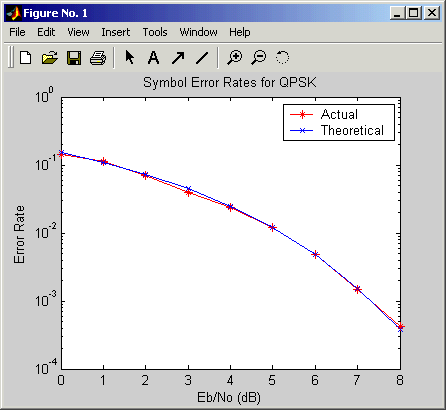
To plot error rates as a function of noise level using the baseband simulation, execute the following code in MATLAB. The plot includes both the theoretical error rates and the error rates from running the simulation.
modelname='bbmoddoc';

EbNoVec = [0:8];
EsNoVec = EbNoVec + 10*log10(2);
numsims = length(EsNoVec);
SERVec = zeros(numsims,3);

% Set up model so it runs until 100 errors occur.
% Also, remove Display block so model runs more quickly.
load_system(modelname);
set_param(gcs,'StopTime','inf');
set_param([gcs '/Error Rate Calculation'],'stop','on');
delete_line(modelname,'Error Rate Calculation/1','Display/1')
delete_block([modelname '/Display'])

% For each noise level, run the model and save the error data.
for n = 1:numsims
    modex_EsNodB = EsNoVec(n);
    disp(['Iteration #' num2str(n) ' of ' num2str(numsims)]);
    sim(modelname);
    SERVec(n,:) = base_ser_data;
end

% Revert to original parameters in model.
close_system(modelname,0); % Close without saving changes.
open_system(modelname);

% Compute theoretical values.
linEbNoVec = 10 .^ (0.1 .* EbNoVec);
temp = 0.5.*erfc((sqrt(2.*linEbNoVec))./sqrt(2));
ser = temp.*(2 - temp);

% Plot actual and theoretical values on one graph.
figure;
semilogy(EbNoVec,SERVec(:,1),'r-*',EbNoVec,ser,'b-x');
legend('Actual','Theoretical');
xlabel('Eb/No (dB)'); ylabel('Error Rate');
title('Symbol Error Rates for QPSK');
The figure below shows the error curves. Notice that the values from the baseband simulation agree with the theoretical values.
Using the Passband Model to Generate Error Curves
If you want to generate error curves using the passband model, you can use the preceding code after making these modifications:
modelname='bbmoddoc'; to modelname='pbmoddoc';.
base_ser_data to pass_ser_data.
The resulting plot looks very similar to the plot produced using the baseband model, because baseband and passband simulation are equivalent for this purpose.
| | Running an Equivalent Baseband Simulation | Speed of Baseband Versus Passband Models | |