| Communications Toolbox | |
Output from the Example
The example produces output in the MATLAB Command Window like that shown below. Because the message signal and the noise are random, you will probably not get the exact numbers below. (For information about states and repeatable sequences of random numbers, see the reference page for the built-in MATLAB function rand.)
Bit error rates for the two constellations used here
----------------------------------------------------
Gray code constellation:     0.0003
Non-Gray code constellation: 0.00036667
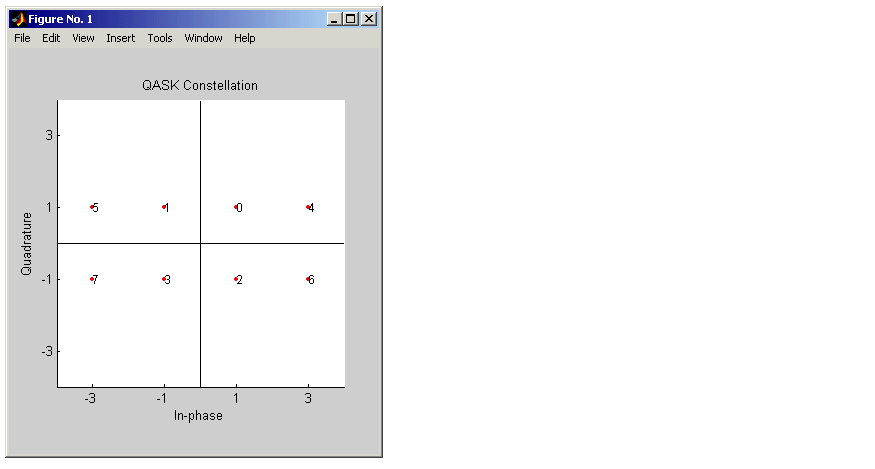
The example also produces a figure window containing the signal constellation plot in the figure below. The horizontal axis represents the in-phase components and the vertical axis represents the quadrature components. The dots are the constellation points. The number next to each dot is the message symbol associated with that dot. By considering the binary form of each number from 0 to M-1, you can check that this constellation implements Gray code.
| | Plotting a Signal Constellation | Using the Communications Toolbox | |