

| MATLAB Function Reference | |
Syntax
R = corrcoef(X)
R = corrcoef(x,y)
[R,P]=corrcoef(...)
[R,P,RLO,RUP]=corrcoef(...)
[...]=corrcoef(...,'param1',val1,'param2',val2,...)
Description
R = corrcoef(X)
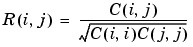
returns a matrix R of correlation coefficients calculated from an input matrix X whose rows are observations and whose columns are variables. The matrix R = corrcoef(X) is related to the covariance matrix C = cov(X) by
corrcoef(X) is the zeroth lag of the covariance function, that is, the zeroth lag of xcov(x,'coeff') packed into a square array.
R = corrcoef(x,y)
where x and y are column vectors is the same as corrcoef([x y]).
[R,P]=corrcoef(...)
also returns P, a matrix of p-values for testing the hypothesis of no correlation. Each p-value is the probability of getting a correlation as large as the observed value by random chance, when the true correlation is zero. If P(i,j) is small, say less than 0.05, then the correlation R(i,j) is significant.
[R,P,RLO,RUP]=corrcoef(...)
also returns matrices RLO and RUP, of the same size as R, containing lower and upper bounds for a 95% confidence interval for each coefficient.
[...]=corrcoef(...,'param1',val1,'param2',val2,...)
specifies additional parameters and their values. Valid parameters are the following.
The p-value is computed by transforming the correlation to create a t statistic having n-2 degrees of freedom, where n is the number of rows of X. The confidence bounds are based on an asymptotic normal distribution of 0.5*log((1+R)/(1-R)), with an approximate variance equal to 1/(n-3). These bounds are accurate for large samples when X has a multivariate normal distribution. The 'pairwise' option can produce an R matrix that is not positive definite.
Examples
Generate random data having correlation between column 4 and the other columns.
x = randn(30,4);     % Uncorrelated data
x(:,4) = sum(x,2);   % Introduce correlation.
[r,p] = corrcoef(x)  % Compute sample correlation and p-values.
[i,j] = find(p<0.05);  % Find significant correlations.
[i,j]                % Display their (row,col) indices.

r =
    1.0000   -0.3566    0.1929    0.3457
   -0.3566    1.0000   -0.1429    0.4461
    0.1929   -0.1429    1.0000    0.5183
    0.3457    0.4461    0.5183    1.0000

p =
    1.0000    0.0531    0.3072    0.0613
    0.0531    1.0000    0.4511    0.0135
    0.3072    0.4511    1.0000    0.0033
    0.0613    0.0135    0.0033    1.0000

ans =
     4     2
     4     3
     2     4
     3     4
See Also
xcorr, xcov in the Signal Processing Toolbox
| | copyobj | cos | |